Anticipating User Falloff
As we discussed last week, users have a predictable tolerance for wait times through waiting for page loading and information seeking behaviors. The value you get when you calculate expected user tolerance can be useful by itself, but it would be better if you could actually predict the rough numbers of users who will fall off early and late in the wait/seek process.
It is reasonable to say that no two people have the same patience for waiting and searching. Some people will wait and search for an extraordinary amount of time while others get frustrated quickly and give up almost immediately. To expect that all of your users will hold out until the very last moment of the predicted 13, or so, seconds hardly reflects reality.
Instead, we can say that we have some maximum tolerance, L, which we can compute which the very last holdouts will actually wait for. Unfortunately, we also know that a majority of users, if they have to wait very long, won’t even see your site since they will fall off before the page finishes loading. This means that the bulk of the users which see your site will be something less than the number of users who actually attempted to load your site.
There were some really smart guys who lived about 100-200 years ago and did lots of math. The really neat thing is they did a lot of work that I don’t have to reproduce or prove since they were smarter, more patient and far more talented than I am. One of them was named Carl Friedrich Gauss, who some refer to as the Prince of Mathematics. He was really smart. Newton smart. Possibly smarter than Newton.
What does Gauss have to do with user experience?
Gauss is the guy who figured out how to evaluate (1/(2pi)^.5)e^(-1/2*x^2) when integrated from negative to positive infinity. Did I just see your eyes glaze over? It’s alright. That happens to me a lot.
What this really translates to is, Gauss figured out how to work with the statistical standard normal curve. This probably means a lot more to you, right? This function happens to be really useful in developing something meaningful regarding users and their falloff over time from initial click through to our tolerance, L.
I spent an entire weekend where I slept little and did math a lot. During that time, I developed a function, based on the standard normal curve which says something reasonably meaningful about users and how long they are willing to stay on your site and either a) search for what they need and b) not satisfice. I’ll give you the function without justification. Contact me if you want all the formalities, I have them in a folder, on the ready.
Our function looks something very much like the following:
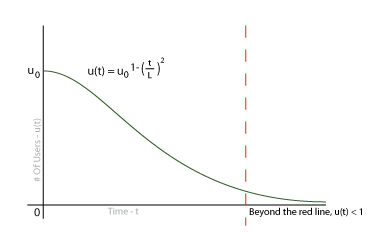
u(t) = u_0^(1-(t/L)^2)
What this says is that the number of users still on your site, at time t, is equal to the initial users times some falloff function evaluated for t. The cool thing is, we already know everything that goes into this little gem when we are testing. We know how many users we started with and we know what L is. The really interesting bit is, when t>L, u(t) is less than one. This means that the probability we will have a user after we reach the maximum tolerance is exactly what we expect it to be.
Below is an estimation of what the graph would look like for your analysis:
[caption id=”” align=”alignnone” width=”380” caption=”User Falloff Over Time”] [/caption]
This may not seem like much of a revelation. We all know that, as people run out of patience, they leave the site. What this does is it gives us something we can plug into our calculators and project some sort of quantified result. What this also means is, if you can produce results which fall beyond the bounds of this graph as you are testing, you know you are outperforming expected results. You can also use this to compare to the number of people who satisfice during testing.
Probably one of the most important things is comparing the number of users who remain on a site for an expected amount of time to the amount of time needed to produce a conversion. This offers a real, concrete means to offer up ROI on your efforts to encourage users to remain on your site.
The uses of this modest function are so numerous I can’t afford the space here to list them. I will offer up more insight into this function as well as other, related, functions which can be used for further prediction. I encourage you to sit and play with this. See how it compares with your test findings. Gauge how you are performing against the model. Improve and test again and, above all else, make the web a better place.